Debugging is the process of finding and fixing errors in the test script. It is a common step in any script development. To make the process more robust, we can make use a plugin "Power Debugger" for Selenium IDE.
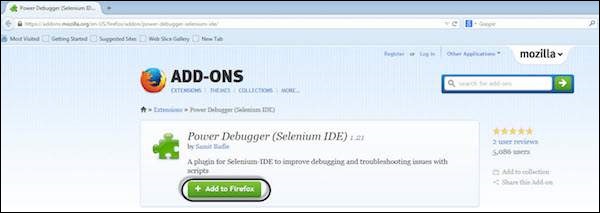
Step 1 : To install Power Debugger for Selenium IDE, navigate to https://addons.mozilla.org/en-US/firefox/addon/power-debugger-selenium-ide/ and click "Add to Firefox" as shown below.
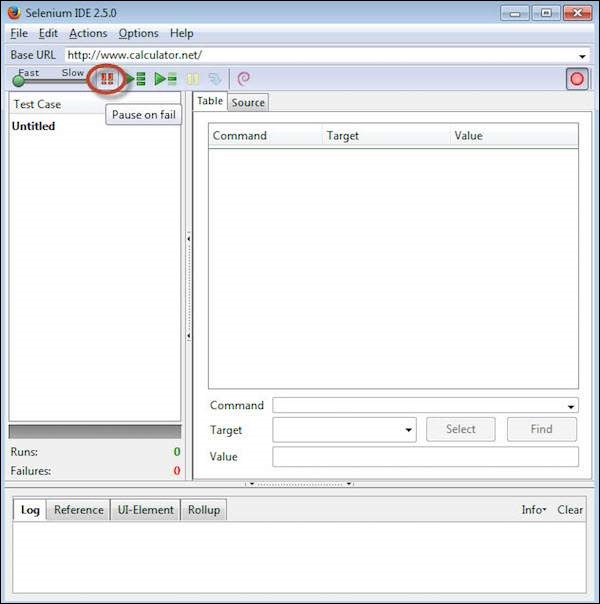
Step 2 : Now launch 'Selenium IDE' and you will notice a new icon, "Pause on Fail" on recording toolbar as shown below. Click it to turn it ON. Upon clicking again, it would be turned "OFF".
Step 3 : Users can turn "pause on fail" on or off any time even when the test is running.
Step 4 : Once the test case pauses due to a failed step, you can use the resume/step buttons to continue the test execution. The execution will NOT be paused if the failure is on the last command of any test case.
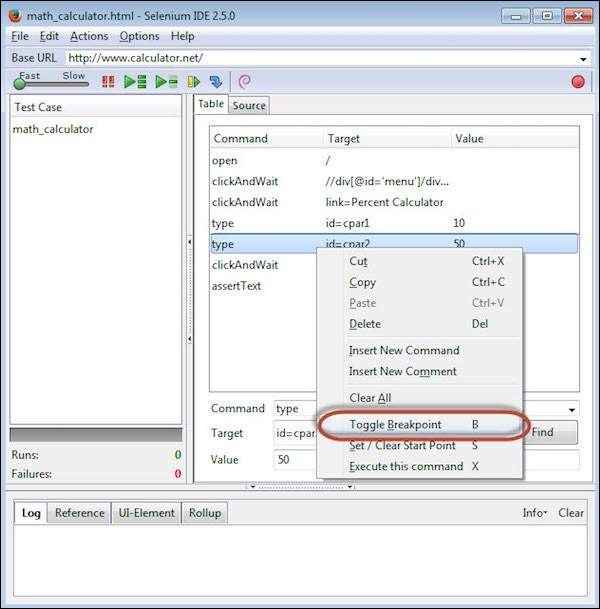
Step 5 : We can also use breakpoints to understand what exactly happens during the step. To insert a breakpoint on a particular step, "Right Click" and select "Toggle Breakpoint" from the context-sensitive menu.
Step 6 : Upon inserting the breakpoint, the particular step is displayed with a pause icon as shown below.
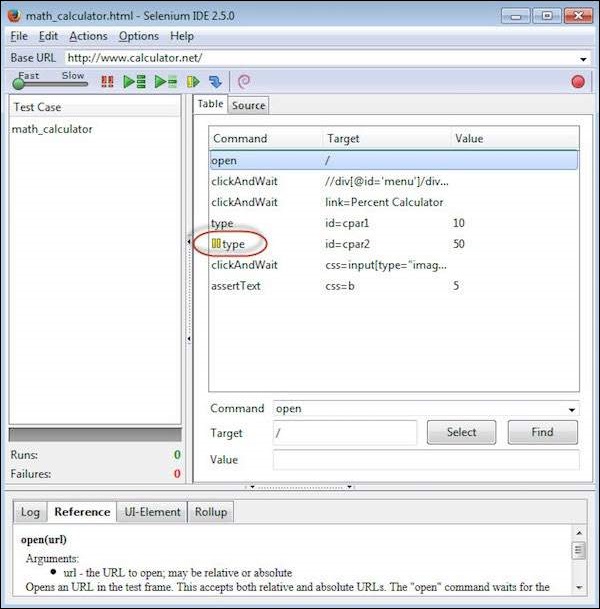
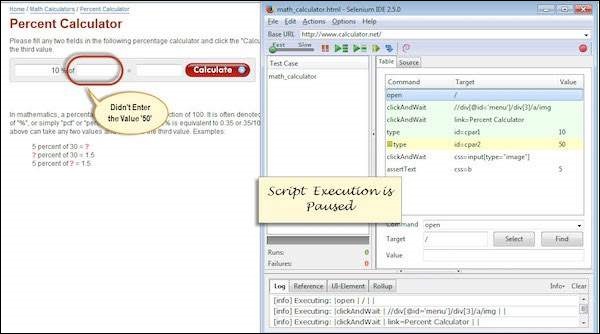
Step 7 : When we execute the script, the script execution is paused where the breakpoint is inserted. This will help the user to evaluate the value/presence of an element when the execution is in progress.
No comments:
Post a Comment